Fraunhofer Institute for Manufacturing Engineering and Automation IPA
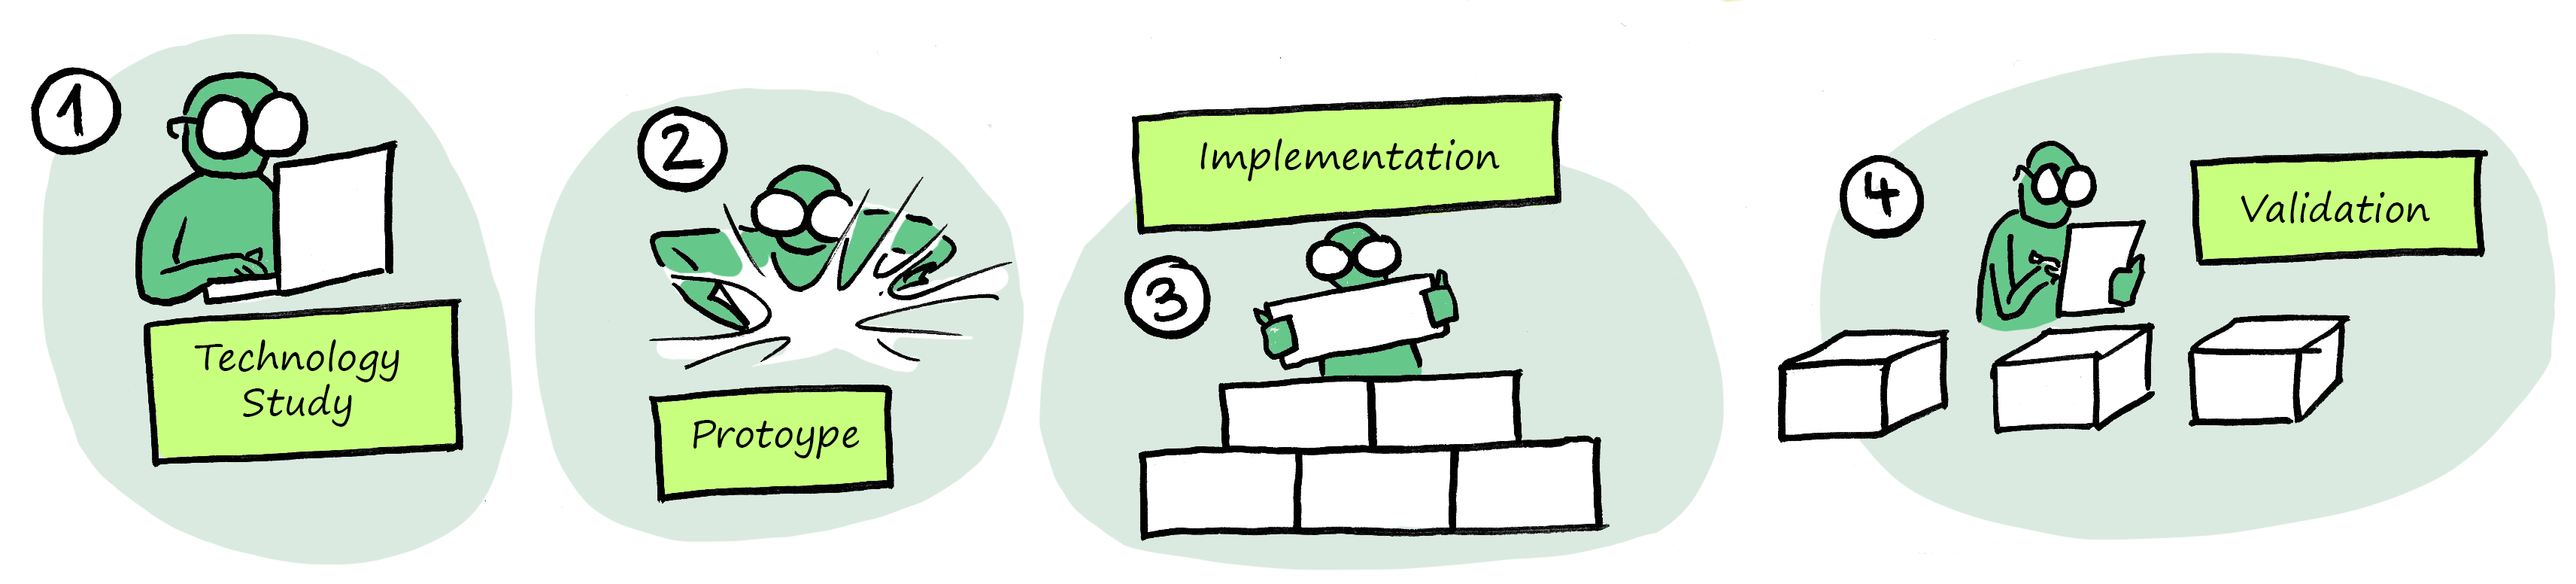
EPSON MFP image
The results of factory planning projects are complex: factory targets are readjusted, processes are radically changed so that production can be digitized, basic elements of lean production are introduced more consistently, and factory layouts and intralogistics are restructured.
When a new factory is built or the production process is digitized, the focus is always on profitability, targets, milestones, potential, quality, and complexity.
The project team itself is knows exactly what was achieved over the last few weeks and is looking forward to the changes. The objectives and respective measures are clear. But how do you communicate the results of such complex projects and strategic realignments to the people concerned in a clear and emotionally convincing way? How can you get the top management involved and gain the support of the entire workforce for the project?
Obviously: visual storytelling makes the factory vision understandable and clarifies the realigned production strategy.
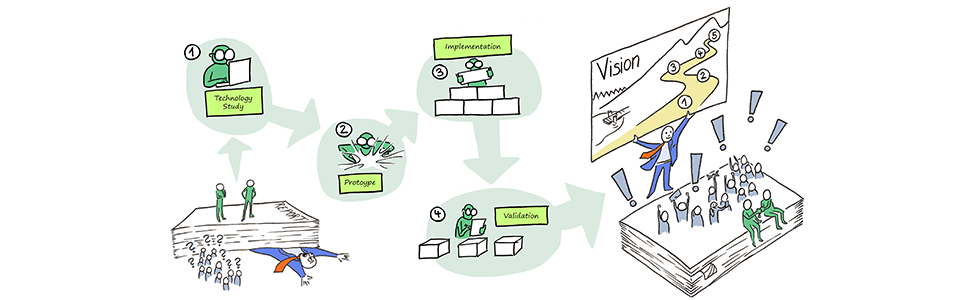
In strategically relevant projects, concept maps developed using the methods of visual facilitation or graphic recording are very helpful to visualize project results based on the rules of design and storytelling.
A good map illustrates the essence of a project in several dimensions. Just like with a project plan, the order is clear: What will happen first? Where are we headed? Thanks to arrows, different colors and the way the map is set out, targets and dependencies are also intuitively clearly depicted: Who is working with whom? Why are we actually doing this?
Besides the quantitative facts, the concept map is primarily about conveying emotions and the vision. Just like in a good story, decisions can be communicated much better through emotions: What is our vision? Why do we want to go there? The map offers enough freedom to imagine the path yourself and to add your own ideas - a prerequisite for taking the initiative.
But how is such a map created? We always develop the map in collaboration with you. The three typical steps are:
Do you have a complex factory planning, value stream or digitization project and need a story to match the corresponding factory vision?
We would be delighted to provide professional assistance with the project and develop an appropriate communication medium.